
Greater Vancouver
2025 Year in Review
The fewest home sales in over two decades, the most new listings since the mid-1990s, and prices that eased across every property type.
Subscribe for monthly reports-24.7% vs 10-year average
Highest total since the mid-1990s
+34.8% vs 10-year average
$1,174,400 in January 2025
Record listings, the fewest sales in over twenty years
Greater Vancouver recorded 23,800 home sales in 2025, down 10.4% from 2024 and 24.7% below the 10-year average. GVR reports it was the lowest annual total in over twenty years.
At the same time, sellers listed 65,335 homes – up 8.2% on 2024 and the highest total since the mid-1990s, according to GVR. With supply outpacing demand, the composite benchmark price fell from $1,174,400 in January to $1,114,800 in December, a 4.5% drop over the year.
“This year was one for the history books. Although the sales total was the lowest in over two decades, Realtors were still busy listing properties. Sellers brought the highest total of listings to market on record since the mid-1990s, eclipsing the previous record high in 2008 by a little over 1,000 listings.” Andrew Lis, Chief Economist & VP Data Analytics, Greater Vancouver Realtors
- Rates: the Bank of Canada cut its policy rate four times in 2025, from 3.25% to 2.25%.
- Trade tensions: GVR says trade tensions with the US weighed on sales and prices in 2025, and that their impact appeared to be easing by the second half of the year.
- Busiest and quietest months: sales peaked at 2,286 in July and were lowest at 1,537 in December.
How 2025 unfolded
Sales stayed below last year's pace for most of 2025, the sales-to-active ratio held in the 11–15% range, and the benchmark price drifted lower from March onward.
Home sales
Monthly MLS® sales, 2025Sales-to-active ratio
All property typesBenchmark price
Composite MLS® HPI, all homes| 2025 | Sales (vs 2024) | New listings | Active listings | Sales-to-active | Benchmark (vs 2024) |
|---|---|---|---|---|---|
| Jan | 1,552+8.8% | 5,566 | 11,494 | 14.1% | $1,174,400+0.7% |
| Feb | 1,827-11.7% | 5,057 | 12,744 | 14.8% | $1,185,100+0.3% |
| Mar | 2,091-13.4% | 6,455 | 14,546 | 14.9% | $1,190,900-0.6% |
| Apr | 2,163-23.6% | 6,850 | 16,207 | 13.8% | $1,184,500-1.8% |
| May | 2,228-18.5% | 6,620 | 17,094 | 13.4% | $1,177,100-2.9% |
| Jun | 2,181-9.8% | 6,315 | 17,561 | 12.8% | $1,173,100-2.8% |
| Jul | 2,286-2.0% | 5,642 | 17,168 | 13.8% | $1,165,300-2.7% |
| Aug | 1,959+2.9% | 4,225 | 16,242 | 12.4% | $1,150,400-3.8% |
| Sep | 1,875+1.2% | 6,527 | 17,079 | 11.3% | $1,142,100-3.2% |
| Oct | 2,255-14.3% | 5,438 | 16,393 | 14.2% | $1,132,500-3.4% |
| Nov | 1,846-15.4% | 3,674 | 15,149 | 12.6% | $1,123,700-3.9% |
| Dec | 1,537-12.9% | 1,849 | 12,550 | 12.7% | $1,114,800-4.5% |
January and February benchmark prices reflect GVR's March 2025 correction to its price index data.
How each segment finished the year
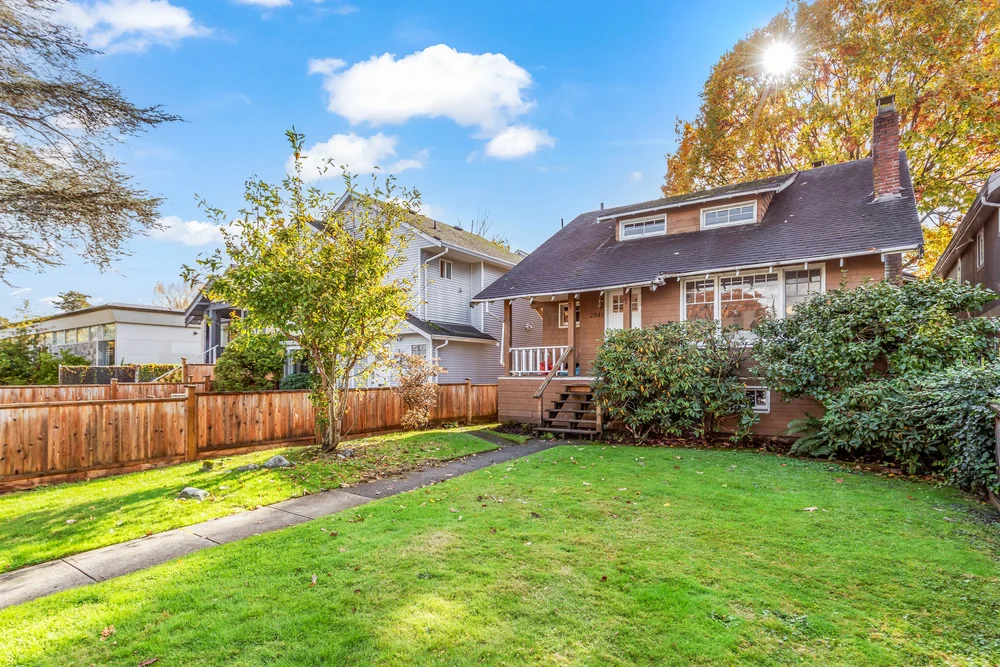
Detached
- vs December 2024
- -5.3%
- 2025 sales
- 6,725 (-10.8%)
- 2025 new listings
- 20,322 (+8.6%)
- Sales-to-active, Dec
- 9.3%
Sales fell by about a tenth while new listings rose, and the December ratio sat in buyer's-market territory.
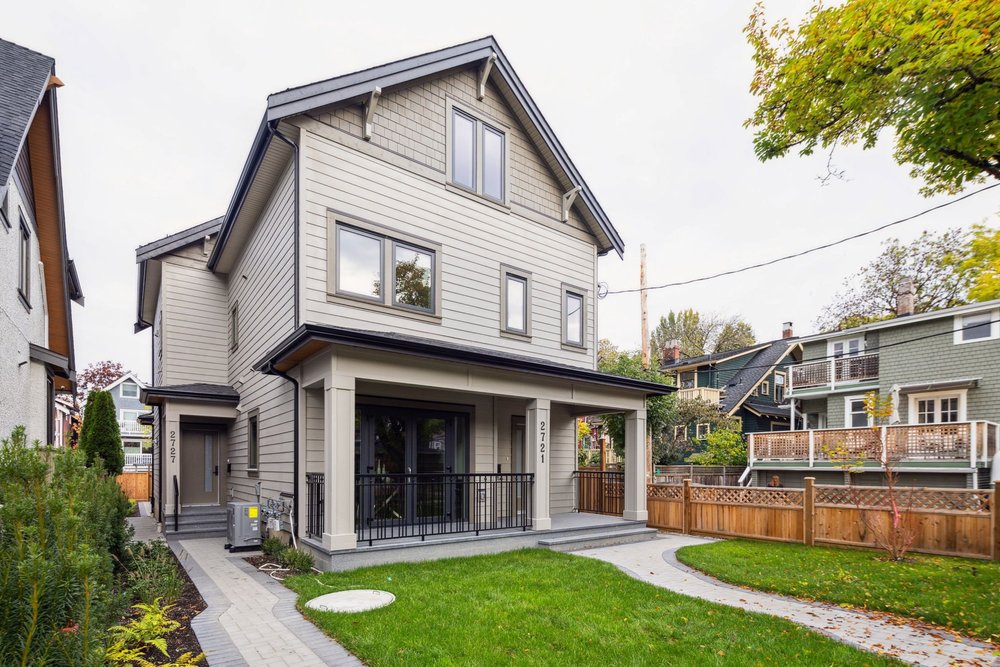
Townhouses & duplexes
- vs December 2024
- -5.0%
- 2025 sales
- 4,890 (-6.9%)
- 2025 new listings
- 12,584 (+14.5%)
- Sales-to-active, Dec
- 14.6%
The smallest drop in sales of the three types, although new listings rose the most (+14.5%).
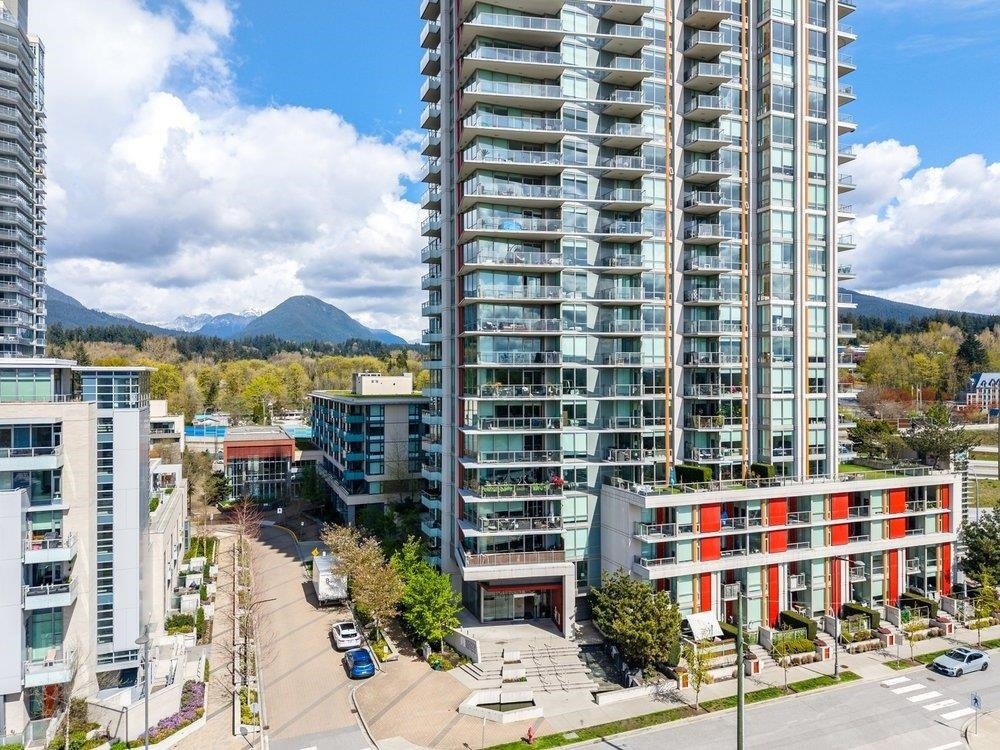
Condos
- vs December 2024
- -5.3%
- 2025 sales
- 12,038 (-11.2%)
- 2025 new listings
- 31,277 (+6.2%)
- Sales-to-active, Dec
- 15.1%
The largest segment by volume. Sales fell 11.2% while new listings rose 6.2%.
GVR reports duplexes, townhouses and row homes together as “attached” homes. Annual sales and listings by type are year-to-date totals from GVR's December 2025 statistics package.
Demand across Greater Vancouver in 2025
Homes sold in 2025 for every 100 new listings that came on, with the number of sales and the change from 2024 underneath. As a guide: under 40% leans toward buyers, 40–60% is balanced, and over 60% leans toward sellers.
| Area | Detached | Townhouse & duplex | Condo | All types |
|---|---|---|---|---|
| Vancouver West | 29%645 sales (-19%) | 31%587 sales (-4%) | 38%3,119 sales (-5%) | 35% |
| Vancouver East | 34%765 sales (-13%) | 35%746 sales (-9%) | 39%1,149 sales (-15%) | 37% |
| North Vancouver | 38%691 sales (-3%) | 41%395 sales (-6%) | 39%943 sales (-12%) | 39% |
| West Vancouver | 22%366 sales (-9%) | 25%46 sales (+7%) | 33%148 sales (-25%) | 24% |
| Burnaby | 31%486 sales (-23%) | 40%472 sales (-8%) | 39%1,987 sales (-15%) | 38% |
| Richmond | 31%632 sales (-19%) | 37%565 sales (-12%) | 36%1,339 sales (-12%) | 35% |
| Coquitlam | 34%594 sales (-2%) | 39%490 sales (+7%) | 37%1,023 sales (-12%) | 36% |
| New Westminster | 30%136 sales (-20%) | 36%126 sales (+4%) | 40%726 sales (-13%) | 37% |
| Port Moody | 33%150 sales (+13%) | 44%159 sales (-9%) | 34%287 sales (-8%) | 36% |
| Port Coquitlam | 35%231 sales (-9%) | 47%192 sales (-14%) | 44%294 sales (-17%) | 41% |
| Maple Ridge / Pitt Meadows | 34%773 sales (-21%) | 45%459 sales (-24%) | 43%375 sales (-15%) | 38% |
| South Delta | 37%363 sales (0%) | 41%189 sales (-4%) | 48%210 sales (+14%) | 40% |
| Squamish | 55%192 sales (+11%) | 59%208 sales (+11%) | 46%153 sales (+15%) | 54% |
Across these 13 areas, 22,411 sales against 61,269 new listings works out to 37%. Sales fell from 2024 in most areas and property types; Squamish (all three types), Coquitlam townhouses, Port Moody detached homes and South Delta condos were among the few that recorded more sales than in 2024.
Benchmark prices by area
The benchmark price describes a typical home in each area at the end of 2025, with the change from December 2024 underneath. Squamish was the only area where all three property types rose over the year; Burnaby North townhouses (+0.7%) were the only other gain.
| Area | Detached | Townhouse & duplex | Condo |
|---|---|---|---|
| Vancouver West | $3,137,400-5.4% | $1,413,200-7.4% | $782,200-4.7% |
| Vancouver East | $1,718,800-7.6% | $1,035,100-8.7% | $650,100-5.9% |
| North Vancouver | $2,041,600-3.8% | $1,257,600-4.3% | $775,500-2.8% |
| West Vancouver | $3,070,000-6.6% | n/a | $1,077,300-10.8% |
| Burnaby North | $1,930,400-7.8% | $927,900+0.7% | $699,400-5.0% |
| Burnaby South | $2,022,300-8.8% | $987,300-3.0% | $765,900-7.6% |
| Richmond | $2,036,800-5.0% | $1,057,400-7.3% | $676,400-6.3% |
| Coquitlam | $1,670,400-4.6% | $994,300-6.8% | $681,100-6.1% |
| New Westminster | $1,486,700-6.8% | $882,700-7.3% | $618,700-5.4% |
| Port Moody | $2,001,800-4.1% | $981,800-2.1% | $710,000-5.3% |
| Port Coquitlam | $1,343,000-2.5% | $882,800-5.8% | $594,400-5.3% |
| Maple Ridge | $1,224,800-4.8% | $744,400-4.7% | $514,400-8.0% |
| Tsawwassen | $1,478,600-7.3% | $929,800-7.6% | $632,800-1.0% |
| Squamish | $1,660,900+9.1% | $1,019,500+1.5% | $578,200+2.5% |
Four rate cuts in one year
The Bank of Canada started 2025 at 3.25% and ended it at 2.25%, with four quarter-point cuts and four holds. GVR notes that borrowing costs fell nearly one full percentage point over the year.
A mid-2025 snapshot of values
BC Assessment's 2026 notices value homes as of July 1, 2025, so they capture the market partway through the year. Most Lower Mainland homeowners saw changes between -10% and 0%. The composite benchmark price fell a further 4.3% between July and December 2025.
“The softening housing market is being reflected in 2026 property assessments.” Bryan Murao, Assessor, BC Assessment
| Municipality | Single-family (typical) | Strata (typical) |
|---|---|---|
| City of Vancouver | $2,092,000-5% | $772,000-3% |
| West Vancouver | $2,910,000-5% | $1,354,000-2% |
| North Vancouver (District) | $2,056,000-3% | $928,000-2% |
| North Vancouver (City) | $1,937,000-3% | $820,000-2% |
| Burnaby | $1,959,000-4% | $706,000-4% |
| Richmond | $1,745,000-8% | $735,000-6% |
| Coquitlam | $1,649,000-5% | $699,000-4% |
| Port Moody | $1,778,000-4% | $797,000-5% |
| Port Coquitlam | $1,358,000-4% | $648,000-5% |
| New Westminster | $1,560,000-2% | $617,000-4% |
| Delta | $1,353,000-4% | $722,000-5% |
| Maple Ridge | $1,183,000-3% | $635,000-2% |
| Squamish | $1,515,000+2% | $848,000+2% |
Typical assessed values for the 2026 roll, with change from the 2025 roll. Strata includes condos and townhouses. Source: BC Assessment, January 2, 2026.
What GVR said about the year ahead
Starting conditions
“With lower prices, lower borrowing costs, and plenty of inventory to choose from, homebuyers in 2026 are starting the year with favorable conditions.” – Andrew Lis, GVR, January 5, 2026
GVR's 2026 forecast
“Our recent 2026 forecast suggests this year is likely to resemble 2025 on many fronts, and we expect sales to remain tepid.” – Andrew Lis, GVR, February 3, 2026
How 2026 is tracking
Through August 2026, the composite benchmark was $1,081,900 (-5.6% year over year). Follow each month in the monthly market reports.
Want to know what this means for your street?
Every neighbourhood – and every home – is a little different. I'm happy to put together a custom report on your area or talk through your plans.
Get in touch Get the monthly report