
Greater Vancouver
2024 Year in Review
Sales edged up from 2023, new listings jumped almost 19%, and the Bank of Canada began cutting rates – ending the year at 3.25%.
Subscribe for monthly reports-20.9% vs 10-year average
+5.7% vs 10-year average
+25.3% vs 10-year average
$1,161,300 in January 2024
A pivot year as rates started to fall
Greater Vancouver recorded 26,561 home sales in 2024, up 1.2% from 2023 but 20.9% below the 10-year average.
Sellers listed 60,388 homes – up 18.7% on 2023 – and active listings ended the year 24.4% higher than in December 2023. The composite benchmark price peaked at $1,212,000 in May and finished December at $1,171,500, up 0.5% from a year earlier.
“Looking back on 2024, it could best be described as a pivot year for the market after experiencing such dramatic increases in mortgage rates in the preceding years. With borrowing costs now firmly on the decline, buyers have started to show up in numbers after somewhat of a hiatus – and this renewed strength is now clearly visible in the more recent monthly data.” Andrew Lis, Chief Economist & VP Data Analytics, Greater Vancouver Realtors
- Rates: the Bank of Canada held at 5.00% until June, then cut five times to end 2024 at 3.25%.
- A strong finish: December sales were up 31.2% on December 2023, and October–December sales were all well above 2023 levels.
- Busiest and quietest months: sales peaked at 2,831 in April and were lowest at 1,427 in January.
How 2024 unfolded
Sales-to-active spent February to May above 20% – seller's-market territory – before easing through the summer. Sales picked up again in the fall as rates came down, and the benchmark price peaked in May.
Home sales
Monthly MLS® sales, 2024Sales-to-active ratio
All property typesBenchmark price
Composite MLS® HPI, all homes| 2024 | Sales (vs 2023) | New listings | Active listings | Sales-to-active | Benchmark (vs 2023) |
|---|---|---|---|---|---|
| Jan | 1,427+38.5% | 3,788 | 8,633 | 17.2% | $1,161,300+4.2% |
| Feb | 2,070+13.5% | 4,560 | 9,634 | 22.4% | $1,183,300+4.5% |
| Mar | 2,415-4.7% | 5,002 | 10,552 | 23.8% | $1,196,800+4.5% |
| Apr | 2,831+3.3% | 7,092 | 12,491 | 23.5% | $1,205,800+2.8% |
| May | 2,733-19.9% | 6,374 | 13,600 | 20.8% | $1,212,000+2.3% |
| Jun | 2,418-19.1% | 5,723 | 14,182 | 17.6% | $1,207,100+0.5% |
| Jul | 2,333-5.0% | 5,597 | 14,326 | 16.9% | $1,197,700-0.8% |
| Aug | 1,904-17.1% | 4,109 | 13,812 | 14.3% | $1,195,900-0.9% |
| Sep | 1,852-3.8% | 6,144 | 14,932 | 12.8% | $1,179,700-1.8% |
| Oct | 2,632+31.9% | 5,452 | 14,477 | 18.8% | $1,172,200-1.9% |
| Nov | 2,181+28.1% | 3,725 | 13,245 | 17.1% | $1,172,100-0.9% |
| Dec | 1,765+31.2% | 1,676 | 10,948 | 16.8% | $1,171,500+0.5% |
Benchmark prices are as originally published by GVR. GVR's 2025 releases compare against slightly revised 2024 figures for some months.
How each segment finished the year
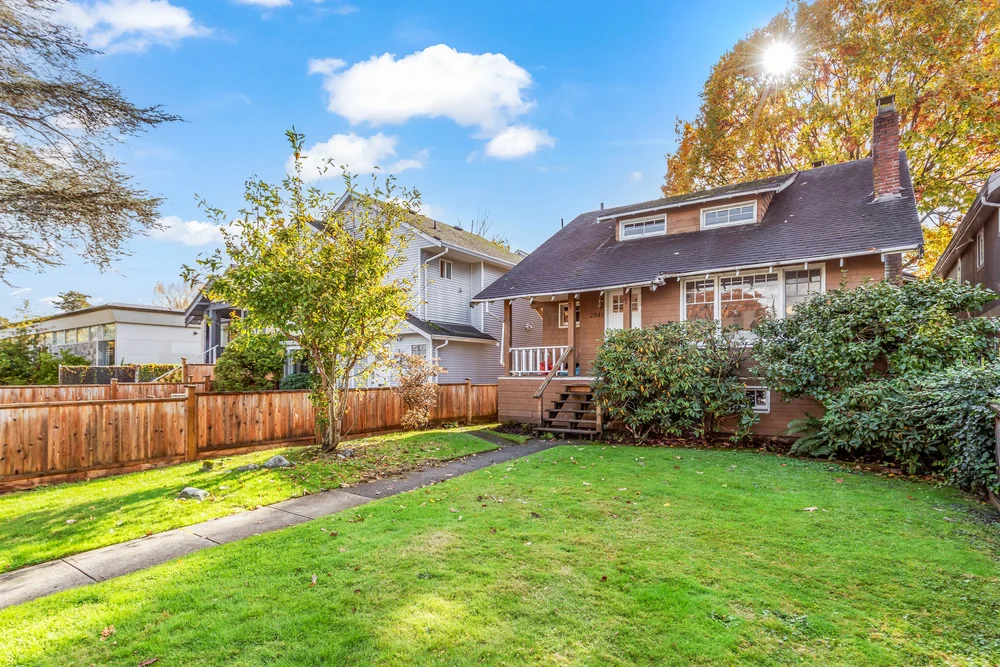
Detached
- vs December 2023
- +2.0%
- 2024 sales
- 7,542 (-0.3%)
- 2024 new listings
- 18,721 (+14.1%)
- Sales-to-active, Dec
- 12.1%
Sales were flat on 2023 while new listings rose 14.1%. The benchmark finished 2.0% higher.
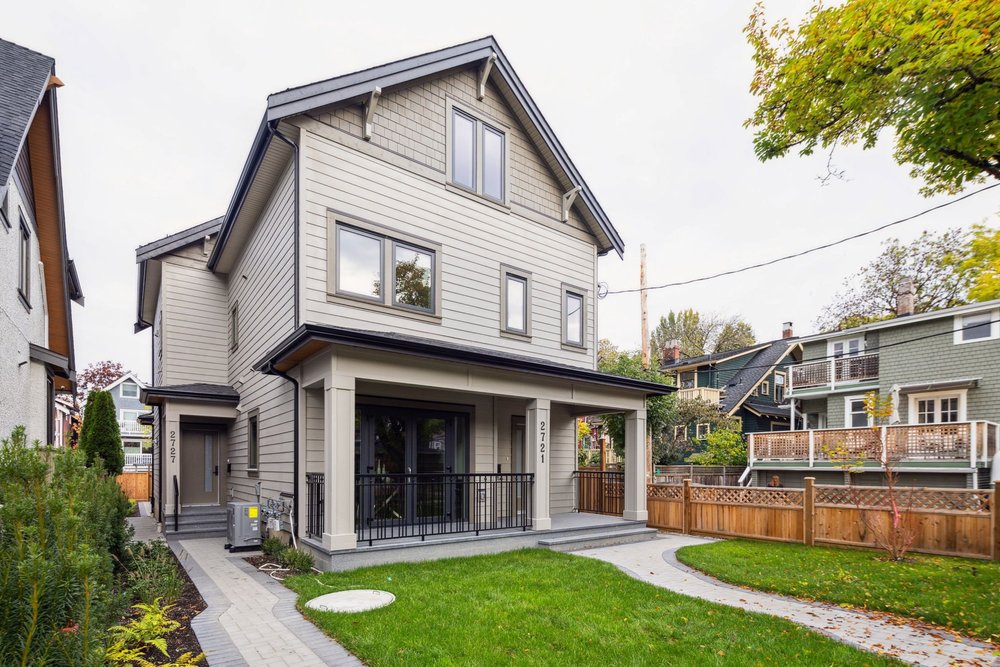
Townhouses & duplexes
- vs December 2023
- +3.4%
- 2024 sales
- 5,250 (+9.5%)
- 2024 new listings
- 10,995 (+25.8%)
- Sales-to-active, Dec
- 23.6%
The only type with more sales than in 2023 (+9.5%), and the tightest in December with a 23.6% sales-to-active ratio.
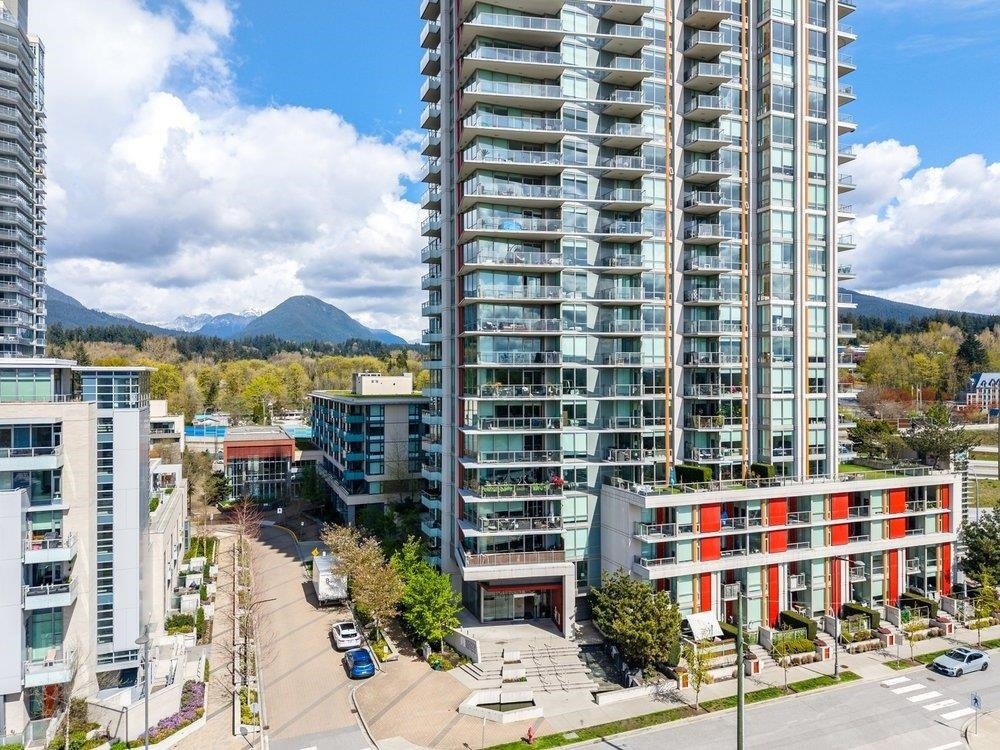
Condos
- vs December 2023
- -0.1%
- 2024 sales
- 13,561 (-0.8%)
- 2024 new listings
- 29,453 (+19.8%)
- Sales-to-active, Dec
- 18.7%
Sales were close to 2023 levels while new listings rose almost 20%. The benchmark ended the year roughly flat.
GVR reports duplexes, townhouses and row homes together as “attached” homes. Annual sales and listings by type are year-to-date totals from GVR's December 2024 statistics package.
Demand across Greater Vancouver in 2024
Homes sold in 2024 for every 100 new listings that came on, with the number of sales and the change from 2023 underneath. As a guide: under 40% leans toward buyers, 40–60% is balanced, and over 60% leans toward sellers.
| Area | Detached | Townhouse & duplex | Condo | All types |
|---|---|---|---|---|
| Vancouver West | 37%793 sales (-3%) | 37%614 sales (+20%) | 40%3,298 sales (-2%) | 39% |
| Vancouver East | 42%882 sales (-2%) | 42%816 sales (+27%) | 47%1,359 sales (+6%) | 44% |
| North Vancouver | 47%712 sales (+3%) | 48%419 sales (+9%) | 49%1,070 sales (-1%) | 48% |
| West Vancouver | 25%401 sales (+9%) | 30%43 sales (-4%) | 38%197 sales (-10%) | 29% |
| Burnaby | 46%629 sales (0%) | 53%515 sales (-9%) | 47%2,351 sales (0%) | 47% |
| Richmond | 42%783 sales (-4%) | 48%640 sales (-2%) | 48%1,526 sales (-12%) | 46% |
| Coquitlam | 39%607 sales (-5%) | 46%460 sales (-1%) | 48%1,164 sales (+5%) | 45% |
| New Westminster | 42%169 sales (-16%) | 47%121 sales (+14%) | 52%837 sales (+13%) | 50% |
| Port Moody | 34%133 sales (-18%) | 63%175 sales (+5%) | 57%311 sales (-20%) | 51% |
| Port Coquitlam | 40%255 sales (+2%) | 60%223 sales (+31%) | 56%353 sales (+6%) | 51% |
| Maple Ridge / Pitt Meadows | 42%976 sales (+5%) | 60%602 sales (+22%) | 45%443 sales (-3%) | 47% |
| South Delta | 49%363 sales (-8%) | 55%197 sales (+14%) | 50%184 sales (+2%) | 51% |
| Squamish | 49%173 sales (+5%) | 61%187 sales (+18%) | 49%133 sales (+20%) | 53% |
Across these 13 areas, 25,114 sales against 56,365 new listings works out to 45%. Sales rose from 2023 in 21 of the 39 area and property-type combinations shown, including townhouse sales in 9 of the 13 areas.
Benchmark prices by area
The benchmark price describes a typical home in each area at the end of 2024, with the change from December 2023 underneath. Results were mixed across the region: Vancouver West townhouses rose the most (+10.0%), while Squamish condos fell the most (-15.3%).
| Area | Detached | Townhouse & duplex | Condo |
|---|---|---|---|
| Vancouver West | $3,374,900-2.5% | $1,527,200+10.0% | $819,400+1.0% |
| Vancouver East | $1,855,700+0.3% | $1,147,000+7.2% | $690,200+0.5% |
| North Vancouver | $2,130,900-2.5% | $1,311,700-0.8% | $796,100+0.6% |
| West Vancouver | $3,308,300+6.1% | n/a | $1,226,100-4.3% |
| Burnaby North | $2,133,100+4.2% | $912,700+0.4% | $734,900-1.4% |
| Burnaby South | $2,233,000+8.0% | $1,056,300-2.2% | $837,000-0.6% |
| Richmond | $2,140,900+1.4% | $1,134,800+3.0% | $724,400-1.4% |
| Coquitlam | $1,772,700-1.0% | $1,071,600+4.5% | $728,700+1.7% |
| New Westminster | $1,579,700+6.1% | $956,600+5.6% | $650,200+0.5% |
| Port Moody | $2,095,800+0.8% | $1,030,700+0.7% | $752,100+3.7% |
| Port Coquitlam | $1,379,500+0.6% | $940,700+3.4% | $631,700+4.1% |
| Maple Ridge | $1,286,800+3.8% | $777,100+3.8% | $530,200+0.4% |
| Tsawwassen | $1,594,600+1.6% | $1,008,200+6.4% | $639,700-6.1% |
| Squamish | $1,518,500+0.5% | $1,030,800+0.3% | $563,800-15.3% |
The year rate cuts began
The Bank of Canada held its policy rate at 5.00% for the first three decisions of 2024, then cut five times from June – three quarter-point cuts and two half-point cuts – to end the year at 3.25%.
A mid-2024 snapshot of values
BC Assessment's 2025 notices value homes as of July 1, 2024, so they capture the market partway through the year. BC Assessment said most homeowners could expect changes in the range of -5% to +5%. The composite benchmark price fell a further 2.2% between July and December 2024.
“Across the Lower Mainland and throughout B.C., the overall housing market has generally stabilized in value for a second consecutive year. Most homeowners can expect only modest assessment changes in the range of -5% to +5%.” Bryan Murao, Assessor, BC Assessment
| Municipality | Single-family (typical) | Strata (typical) |
|---|---|---|
| City of Vancouver | $2,206,0000% | $798,000-1% |
| West Vancouver | $3,052,0000% | $1,388,000-1% |
| North Vancouver (District) | $2,124,000+2% | $940,000+1% |
| North Vancouver (City) | $1,990,0000% | $839,0000% |
| Burnaby | $2,044,000+4% | $732,0000% |
| Richmond | $1,890,000+1% | $784,000+1% |
| Coquitlam | $1,738,000+1% | $727,000+1% |
| Port Moody | $1,851,000+1% | $841,000+2% |
| Port Coquitlam | $1,416,000+2% | $680,000+2% |
| New Westminster | $1,590,000+1% | $644,0000% |
| Delta | $1,410,0000% | $759,000+2% |
| Maple Ridge | $1,223,0000% | $655,0000% |
| Squamish | $1,483,000+1% | $833,000+1% |
Typical assessed values for the 2025 roll, with change from the 2024 roll. Strata includes condos and townhouses. Source: BC Assessment, January 2, 2025.
What GVR said about the year ahead
Momentum into 2025
“These more recent sales figures are now trending back towards long-term historical averages, which suggests there may still be quite a bit of potential upside for sales as we head into 2025, should the recent strength continue.” – Andrew Lis, GVR, January 3, 2025
GVR's 2025 forecast
“Sales are expected to continue building on the strong year-over-year gains over the past few months, before stabilizing in line with historical norms by mid-year.” – GVR Economics, January 2025
How 2025 turned out
Sales fell 10.4% to 23,800 and the December benchmark was $1,114,800 (-4.5% year over year). Read the 2025 Year in Review.
Want to know what this means for your street?
Every neighbourhood – and every home – is a little different. I'm happy to put together a custom report on your area or talk through your plans.
Get in touch Get the monthly report