
Greater Vancouver
2023 Year in Review
Sales fell 10.3%, new listings stayed well below normal, and benchmark prices finished the year about 5% higher despite the highest borrowing costs in over a decade.
Subscribe for monthly reports-23.4% vs 10-year average
-10.5% vs 10-year average
+0.3% vs 10-year average
$1,111,400 in January 2023
Prices held firm in a year of high rates
Greater Vancouver recorded 26,249 home sales in 2023, down 10.3% from 2022 and 23.4% below the 10-year average.
Sellers listed 50,893 homes – 7.5% fewer than in 2022 and 10.5% below the 10-year average. With supply this tight, the composite benchmark price rose from $1,111,400 in January to a peak of $1,210,700 in July and finished December at $1,168,700, up 5.0% from a year earlier.
“You could miss it by just looking at the year-end totals, but 2023 was a strong year for the Metro Vancouver housing market considering that mortgage rates were the highest they've been in over a decade.” Andrew Lis, Director of Economics and Data Analytics, Real Estate Board of Greater Vancouver (now Greater Vancouver Realtors)
- Rates: the Bank of Canada raised its policy rate three times in 2023 – in January, June and July – taking it from 4.25% to 5.00%, then held for the rest of the year.
- Tight supply: REBGV says sellers were reluctant to list early in the year, which led to near record-low inventory in the spring and upward pressure on prices.
- Busiest and quietest months: sales peaked at 3,411 in May and were lowest at 1,022 in January.
How 2023 unfolded
The sales-to-active ratio spent February to August above 20% – seller's-market territory – peaking at 38.4% in May, then settled into balanced territory in the fall as listings rose. The benchmark price climbed through the first half of the year and peaked in July.
Home sales
Monthly MLS® sales, 2023Sales-to-active ratio
All property typesBenchmark price
Composite MLS® HPI, all homes| 2023 | Sales (vs 2022) | New listings | Active listings | Sales-to-active | Benchmark (vs 2022) |
|---|---|---|---|---|---|
| Jan | 1,022-55.3% | 3,297 | 7,478 | 13.7% | $1,111,400-6.6% |
| Feb | 1,808-47.2% | 3,467 | 7,868 | 23.0% | $1,123,400-9.3% |
| Mar | 2,535-42.5% | 4,317 | 8,617 | 30.7% | $1,143,900-9.5% |
| Apr | 2,741-16.5% | 4,307 | 8,790 | 32.7% | $1,170,700-7.4% |
| May | 3,411+15.7% | 5,661 | 9,293 | 38.4% | $1,188,000-5.6% |
| Jun | 2,988+21.1% | 5,348 | 9,990 | 31.4% | $1,203,000-2.4% |
| Jul | 2,455+28.9% | 4,649 | 10,301 | 24.9% | $1,210,700+0.5% |
| Aug | 2,296+21.4% | 3,943 | 10,082 | 23.9% | $1,208,400+2.5% |
| Sep | 1,926+13.2% | 5,446 | 11,382 | 17.7% | $1,203,300+4.4% |
| Oct | 1,996+3.7% | 4,664 | 11,599 | 17.9% | $1,196,500+4.4% |
| Nov | 1,702+4.7% | 3,369 | 10,931 | 16.3% | $1,185,100+4.9% |
| Dec | 1,345+3.2% | 1,327 | 8,802 | 16.0% | $1,168,700+5.0% |
Figures are as originally published by REBGV. During 2023 REBGV began including multifamily and land in its monthly totals (typically one to two per cent of activity).
How each segment finished the year
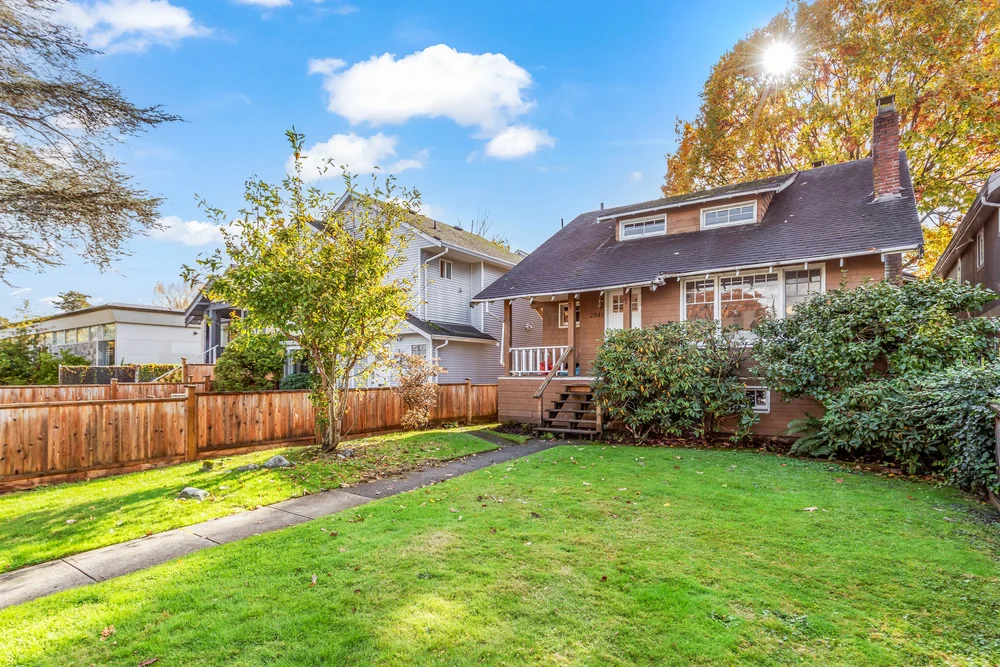
Detached
- vs December 2022
- +7.7%
- 2023 sales
- 7,527 (-9.6%)
- 2023 new listings
- 16,304 (-11.1%)
- Sales-to-active, Dec
- 11.1%
Sales fell 9.6% and new listings fell 11.1%. The benchmark finished the year 7.7% higher.
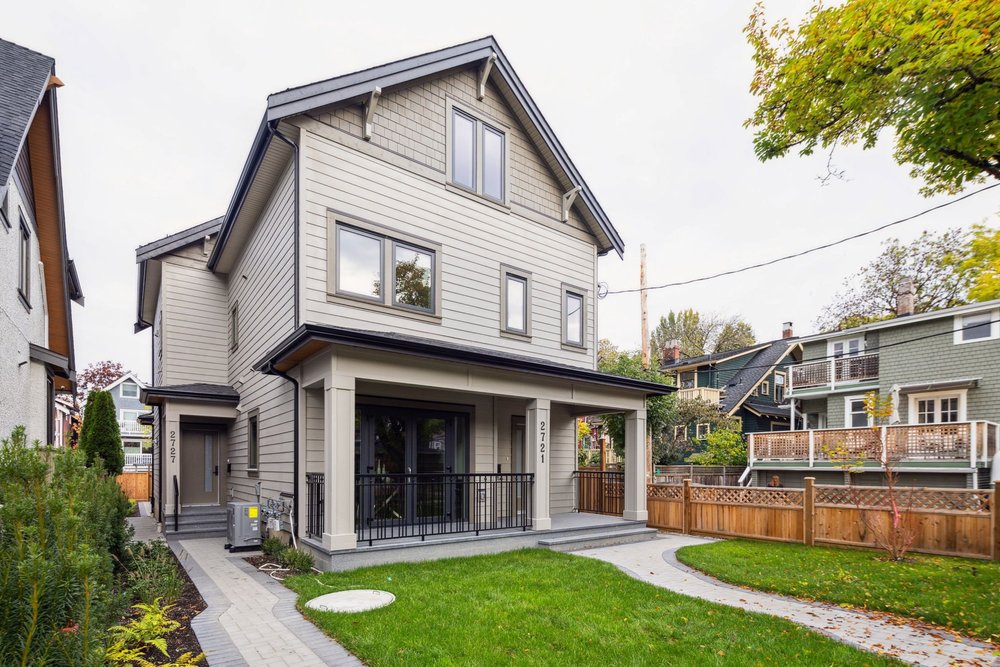
Townhouses & duplexes
- vs December 2022
- +6.4%
- 2023 sales
- 4,793 (-3.8%)
- 2023 new listings
- 8,740 (-4.6%)
- Sales-to-active, Dec
- 18.7%
The smallest drop in sales of the three types (-3.8%). The townhouse benchmark rose 6.4%.
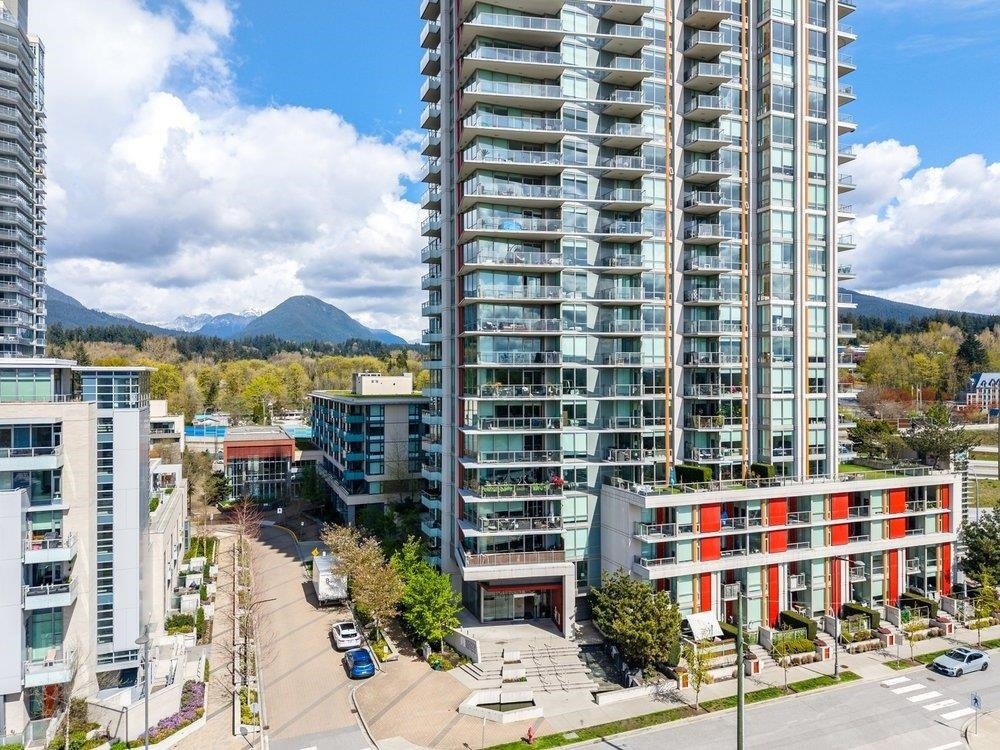
Condos
- vs December 2022
- +5.6%
- 2023 sales
- 13,676 (-12.3%)
- 2023 new listings
- 24,579 (-6.8%)
- Sales-to-active, Dec
- 19.6%
The largest segment by volume, with the biggest drop in sales (-12.3%). The benchmark rose 5.6%.
Townhouse sales, new listings and sales-to-active ratios use REBGV's “attached” category, which also includes row homes and duplexes; the townhouse price is REBGV's MLS® HPI townhouse benchmark. Annual sales and listings by type are year-to-date totals from REBGV's December 2023 statistics package.
Demand across Greater Vancouver in 2023
Homes sold in 2023 for every 100 new listings that came on, with the number of sales and the change from 2022 underneath. GVR doesn't publish active listings by area, so this uses new listings instead and leaves out homes already on the market – treat it as a rough guide: broadly, under 40% leans toward buyers, 40–60% is balanced, and over 60% leans toward sellers.
| Area | Detached | Townhouse & duplex | Condo | All types |
|---|---|---|---|---|
| Vancouver West | 45%818 sales (-5%) | 42%510 sales (-9%) | 46%3,354 sales (-18%) | 45% |
| Vancouver East | 51%901 sales (-6%) | 46%643 sales (+11%) | 54%1,286 sales (-18%) | 51% |
| North Vancouver | 52%693 sales (-8%) | 59%386 sales (-7%) | 61%1,079 sales (-11%) | 58% |
| West Vancouver / Howe Sound | 26%368 sales (-16%) | 37%45 sales (-24%) | 51%220 sales (+29%) | 32% |
| Burnaby | 52%628 sales (-11%) | 62%569 sales (-1%) | 60%2,359 sales (-5%) | 59% |
| Richmond | 47%817 sales (-11%) | 58%651 sales (-16%) | 61%1,740 sales (-12%) | 56% |
| Coquitlam | 54%641 sales (-12%) | 54%467 sales (+26%) | 60%1,113 sales (-14%) | 57% |
| New Westminster | 53%200 sales (-2%) | 57%106 sales (-21%) | 64%738 sales (-17%) | 60% |
| Port Moody / Belcarra | 49%162 sales (-8%) | 67%166 sales (-8%) | 70%390 sales (+24%) | 63% |
| Port Coquitlam | 52%249 sales (-23%) | 68%170 sales (-23%) | 62%332 sales (-21%) | 60% |
| Maple Ridge / Pitt Meadows | 47%926 sales (-5%) | 64%493 sales (-9%) | 55%455 sales (-8%) | 52% |
| South Delta (Ladner & Tsawwassen) | 53%396 sales (-7%) | 58%173 sales (+31%) | 67%180 sales (-15%) | 57% |
| Squamish | 43%165 sales (-12%) | 61%159 sales (-2%) | 54%111 sales (-21%) | 51% |
Across these 13 areas, 24,859 sales against 47,220 new listings works out to 53%. Sales fell from 2022 in 34 of the 39 area and property-type combinations shown; the exceptions were townhouses in Vancouver East, Coquitlam and South Delta, and condos in West Vancouver and Port Moody.
Areas are GVR's sales-and-listings regions, which can cover more ground than the benchmark-price areas below – for example, Burnaby is one area here. Delta appears three ways in this report: GVR's South Delta sales region (Ladner and Tsawwassen) in the table above, separate benchmark prices for Ladner and Tsawwassen below, and BC Assessment's figures for the whole City of Delta, including North Delta.
Benchmark prices by area
The benchmark price describes a typical home in each area at the end of 2023, with the change from December 2022 underneath. Every benchmark shown below rose over the year, led by Squamish condos (+30.4%) and Vancouver West detached homes (+11.4%); West Vancouver detached homes rose the least (+1.3%).
| Area | Detached | Townhouse | Condo |
|---|---|---|---|
| Vancouver West | $3,465,300+11.4% | $1,424,700+6.7% | $816,300+1.9% |
| Vancouver East | $1,857,100+10.3% | $1,072,200+4.3% | $693,000+3.1% |
| North Vancouver | $2,220,000+6.6% | $1,332,000+7.6% | $798,600+6.4% |
| West Vancouver | $3,140,200+1.3% | n/a | $1,271,200+5.6% |
| Burnaby North | $2,054,200+9.0% | $901,800+6.5% | $732,800+4.7% |
| Burnaby South | $2,115,900+4.6% | $1,035,000+9.6% | $809,200+7.3% |
| Richmond | $2,111,400+6.5% | $1,094,000+5.2% | $744,000+8.9% |
| Coquitlam | $1,777,800+6.4% | $1,025,600+4.8% | $711,800+3.6% |
| New Westminster | $1,500,000+6.6% | $914,500+3.8% | $648,400+6.6% |
| Port Moody | $2,090,100+7.4% | $1,007,800+3.2% | $735,000+8.3% |
| Port Coquitlam | $1,377,800+7.9% | $913,000+5.2% | $610,600+2.3% |
| Maple Ridge | $1,245,000+6.7% | $750,500+5.7% | $533,500+5.7% |
| Ladner | $1,387,000+7.1% | $936,500+9.4% | $713,400+6.6% |
| Tsawwassen | $1,567,500+8.8% | $939,300+3.7% | $688,400+6.7% |
| Squamish | $1,541,900+1.6% | $1,041,800+9.0% | $658,200+30.4% |
Three more rate hikes, then a pause
The Bank of Canada raised its policy rate from 4.25% to 4.50% in January, held in March and April, then raised it in June and again in July to 5.00%, where it stayed for the rest of the year.
A mid-2023 snapshot of values
BC Assessment's 2024 notices value homes as of July 1, 2023, so they capture the market partway through the year. BC Assessment said most homeowners could expect changes in the range of -5% to +5%. The composite benchmark price fell 3.5% between July and December 2023. A regional benchmark can't show how far any one home's value has moved from its assessment – that depends on the home itself and recent nearby sales.
“Across the Lower Mainland and throughout B.C., the overall housing market has generally stabilized in value.” Bryan Murao, Assessor, BC Assessment
| Municipality | Single-family (typical) | Strata (typical) |
|---|---|---|
| City of Vancouver | $2,209,000+4% | $807,0000% |
| West Vancouver | $3,050,000-2% | $1,407,000+1% |
| North Vancouver (District) | $2,087,000+2% | $945,000+2% |
| North Vancouver (City) | $1,988,000+2% | $836,0000% |
| Burnaby | $1,973,000+4% | $731,000+1% |
| Richmond | $1,874,000+3% | $779,000+4% |
| Coquitlam | $1,722,000+4% | $720,000+1% |
| Port Moody | $1,824,000+2% | $826,0000% |
| Port Coquitlam | $1,391,000+3% | $669,000+3% |
| New Westminster | $1,567,000+2% | $645,000+3% |
| Delta (incl. North Delta) | $1,406,000-2% | $747,000+2% |
| Maple Ridge | $1,226,000+2% | $658,000+2% |
| Squamish | $1,475,000-1% | $830,000-2% |
Typical (median) assessed values for the 2024 roll, with change from the 2023 roll. Strata includes condos and townhouses. Delta covers the whole City of Delta, including North Delta. Source: BC Assessment, January 2, 2024.
What REBGV said about the year ahead
Rates in 2024
“Looking back on the year, it's hard not to wonder how we'd be closing out 2023 if mortgage rates had been a few per cent lower than they were. And it looks like we might get some insight into that question in 2024, as bond markets and professional forecasters are projecting lower borrowing costs are likely to come, with modest rate cuts expected in the first half of the New Year.” – Andrew Lis, REBGV, January 3, 2024
REBGV's 2024 forecast
“Our 2024 forecast is calling for a two to three per cent increase in prices by the end of the year, which is largely the result of demand, once again, butting up against too little inventory.” – Andrew Lis, REBGV, February 2, 2024
How 2024 turned out
Sales rose 1.2% to 26,561 and the December benchmark was $1,171,500 (+0.5% year over year). Read the 2024 Year in Review.
Want to know what this means for your street?
Every neighbourhood – and every home – is a little different. I'm happy to put together a custom report on your area or talk through your plans.
Get in touch Get the monthly report