
Greater Vancouver
October 2026
Sales and new listings each fell more than 10% from last October as the Bank of Canada raised its rate, but the overall sales-to-active ratio climbed back above 12%.
Subscribe for monthly reports-22.5% vs 10-year October average
+24.0% vs 10-year October average
-0.7% vs September 2026
Buyers and sellers both take a step back
October saw fewer homes both sold and listed than a year ago: 2,024 sales, down 10.2% from last October and 22.5% below the 10-year October average, and 4,805 new listings, down 11.6% and about in line with the 10-year average. With fewer new listings than September's 5,852 and more sales than September's 1,717, the overall sales-to-active ratio rose from 10.9% to 13.4%.
Condo sales fell the most, down 16.7% year over year, while detached sales were down 7.2% and townhouse sales were close to flat at -1.9%. Prices kept easing – the overall benchmark is down 5.2% from last year and 0.7% from September, and every property type slipped again. Townhouses had the highest sales-to-active ratio of the three segments, at 16.5%, and detached homes the lowest, at 11.6%.
“Between the onslaught of news coverage of the provincial and municipal elections, and the uncertainty surrounding where mortgage rates may be headed, it's not entirely surprising that market participants took a step back in October to recalibrate.” Andrew Lis, Chief Economist & VP Data Analytics, Greater Vancouver Realtors
- Rates: the Bank of Canada raised its policy rate by a quarter point to 2.5% on October 28. Its next decision is December 9.
- Rate holds: GVR says some buyers may step in to take advantage of rate holds that will soon be expiring, although higher borrowing costs have eroded the affordability gains from lower prices.
- Prices this year: GVR's overall benchmark is down 2.7% over the past six months and 5.2% over the past year.
Sales-to-active listings ratio
This ratio compares how many homes sold in the month to how many were for sale. Historically, when it stays below 12%, prices tend to soften; above 20% for several months, prices tend to rise.
What each segment is doing
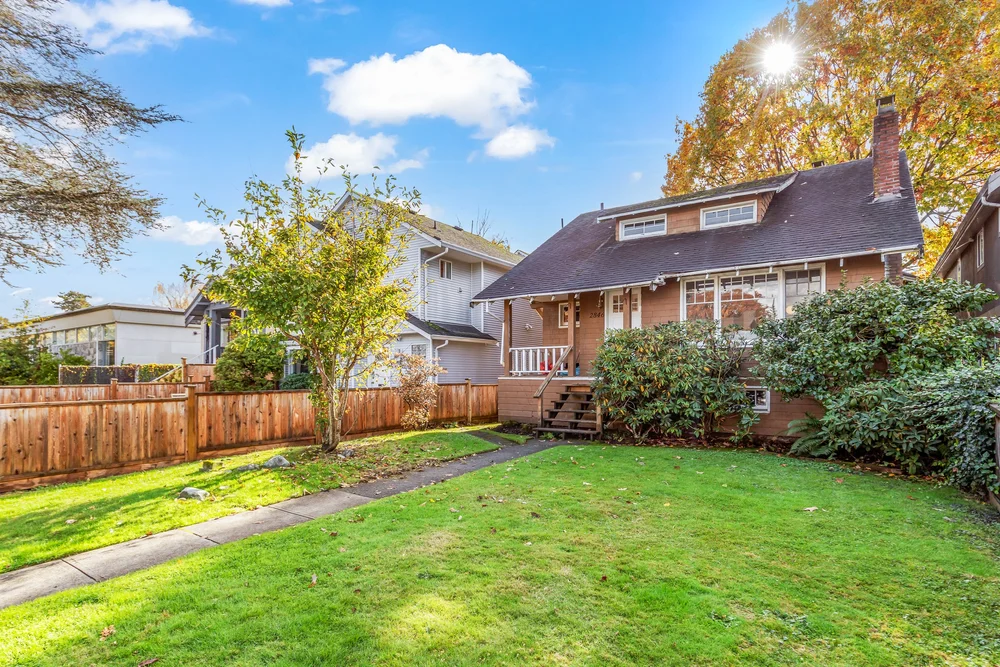
Detached
- vs last year
- -7.0%
- vs last month
- -0.5%
- October sales
- 643 (-7.2%)
- Sales-to-active
- 11.6%
The lowest sales-to-active ratio of the three segments, and the only one still below the 12% line. Buyers have room to negotiate on price, conditions and timing.
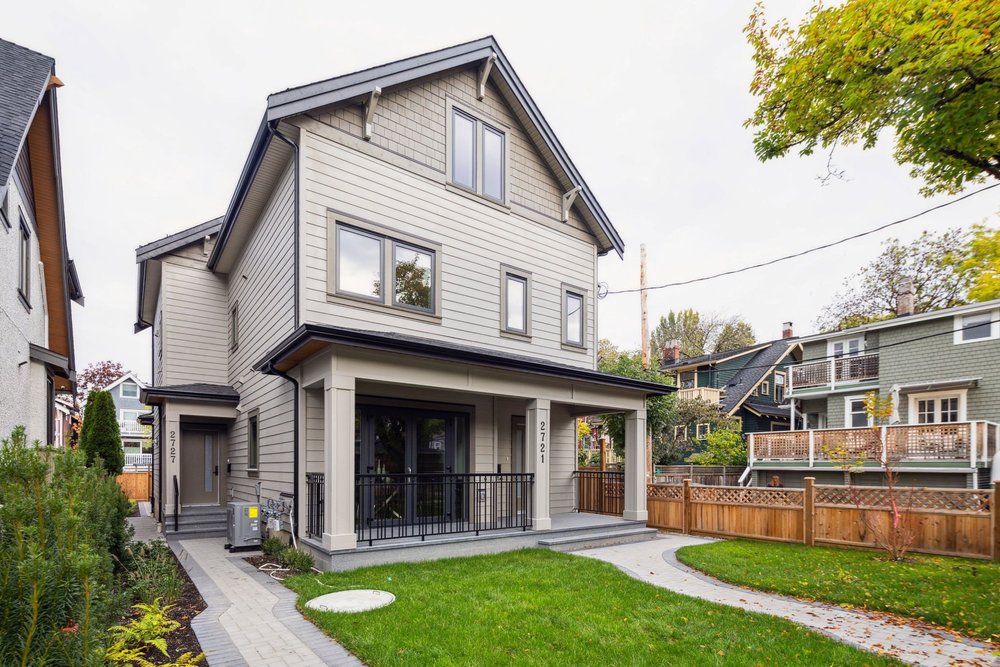
Townhouses & duplexes
- vs last year
- -5.5%
- vs last month
- -1.0%
- October sales
- 468 (-1.9%)
- Sales-to-active
- 16.5%
The highest sales-to-active ratio of the three segments, with sales close to last October's level. The townhouse benchmark still eased 1.0% from September.
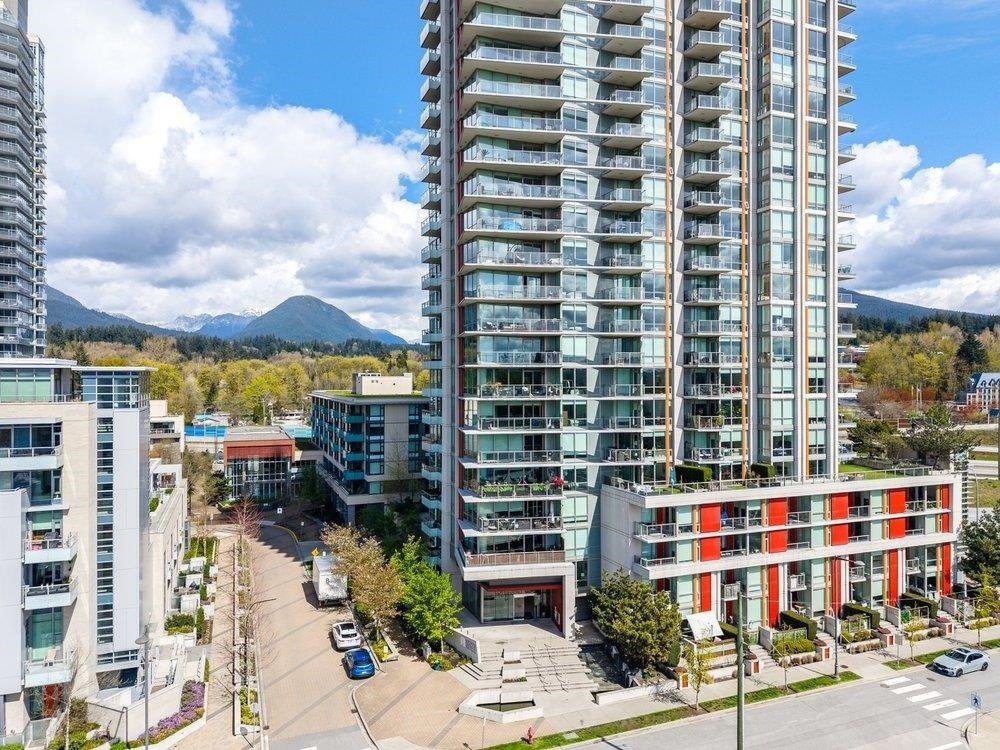
Condos
- vs last year
- -5.9%
- vs last month
- -1.3%
- October sales
- 892 (-16.7%)
- Sales-to-active
- 13.5%
Sales fell the most here and the benchmark had the biggest monthly drop (-1.3%), even with the ratio back above 12%. Buyers generally have more choice, although competition varies by neighbourhood and property.
Townhouse sales and sales-to-active ratios use GVR's “attached” category, which also includes row homes and duplexes. The townhouse price is GVR's MLS® HPI townhouse benchmark. Condo figures cover all apartment-style homes.
Demand across Greater Vancouver
How many homes sold in October for every 100 new listings that came on. GVR doesn't publish active listings by area, so this uses new listings instead – it leaves out homes already on the market, and some sales will be homes listed in earlier months. Treat it as a rough guide: broadly, under 40% leans toward buyers, 40–60% is balanced, and over 60% leans toward sellers.
| Area | Detached | Townhouse & duplex | Condo | All types |
|---|---|---|---|---|
| Vancouver West | 35%65 of 184 | 43%71 of 165 | 33%198 of 604 | 35% |
| Vancouver East | 51%87 of 170 | 30%67 of 222 | 34%83 of 242 | 37% |
| North Vancouver | 46%64 of 138 | 47%28 of 59 | 38%75 of 195 | 43% |
| West Vancouver / Howe Sound | 33%35 of 106 | 21%3 of 14 * | 19%7 of 37 | 29% |
| Burnaby | 41%51 of 124 | 54%62 of 114 | 39%134 of 344 | 42% |
| Richmond | 41%57 of 140 | 55%66 of 119 | 61%128 of 211 | 53% |
| Coquitlam | 53%56 of 106 | 42%48 of 113 | 40%82 of 205 | 44% |
| New Westminster | 31%15 of 48 | 50%9 of 18 * | 43%57 of 134 | 40% |
| Port Moody / Belcarra | 30%13 of 43 | 54%13 of 24 | 36%21 of 58 | 38% |
| Port Coquitlam | 58%19 of 33 | 56%24 of 43 | 55%33 of 60 | 56% |
| Maple Ridge / Pitt Meadows | 51%79 of 156 | 54%35 of 65 | 49%32 of 65 | 51% |
| South Delta (Ladner & Tsawwassen) | 64%29 of 45 | 32%12 of 37 | 70%14 of 20 | 54% |
| Squamish | 43%10 of 23 | 36%14 of 39 | 29%10 of 35 | 35% |
Region-wide, 2,024 sales against 4,805 new listings works out to 42%, up from 29% in September as fewer new listings came on. South Delta condos and detached homes and Richmond condos had the highest sales-to-new-listings ratios, while West Vancouver and Squamish condos, Port Moody detached homes and Vancouver East townhouses had among the lowest.
Areas are GVR's sales-and-listings regions, which can cover more ground than the benchmark-price areas below – for example, Burnaby is one area here. Delta appears three ways in this report: GVR's South Delta sales region (Ladner and Tsawwassen) in the table above, separate benchmark prices for Ladner and Tsawwassen below, and BC Assessment's figures for the whole City of Delta, including North Delta.
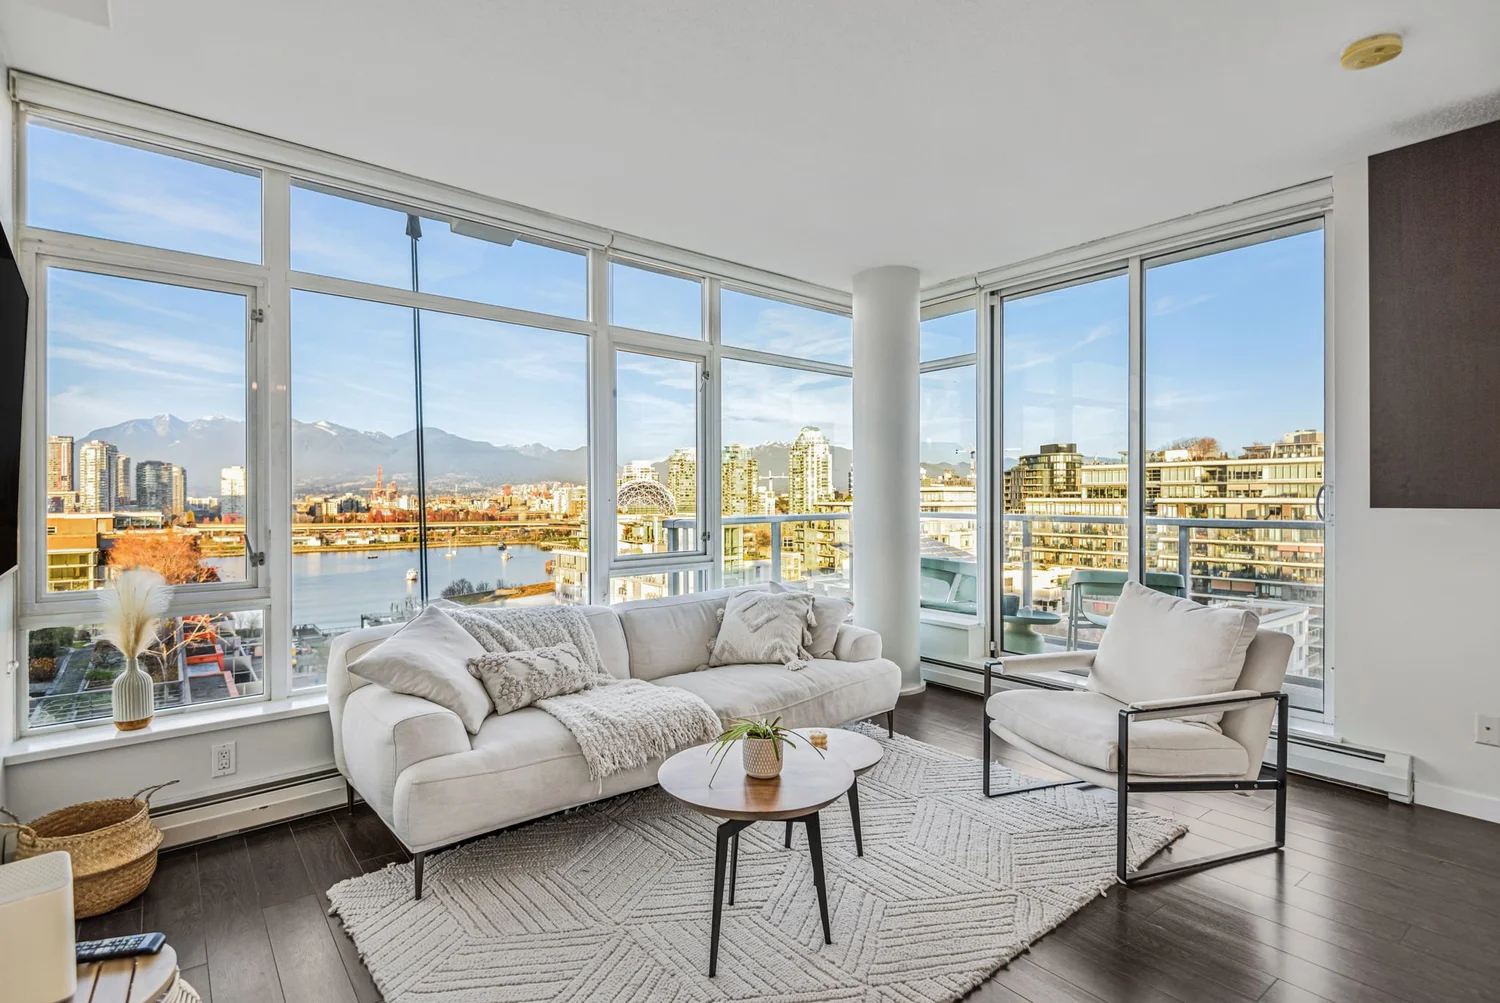
Rates are up, so recheck your numbers
- The Bank of Canada's October 28 increase may change what you can borrow, so check your numbers with your lender before you shop.
- Detached homes are still below the 12% sales-to-active line, which leaves room for price and subject negotiations.
- Active listings are 24.0% above the 10-year October average, so buyers generally have more choice, although competition varies by neighbourhood and property.
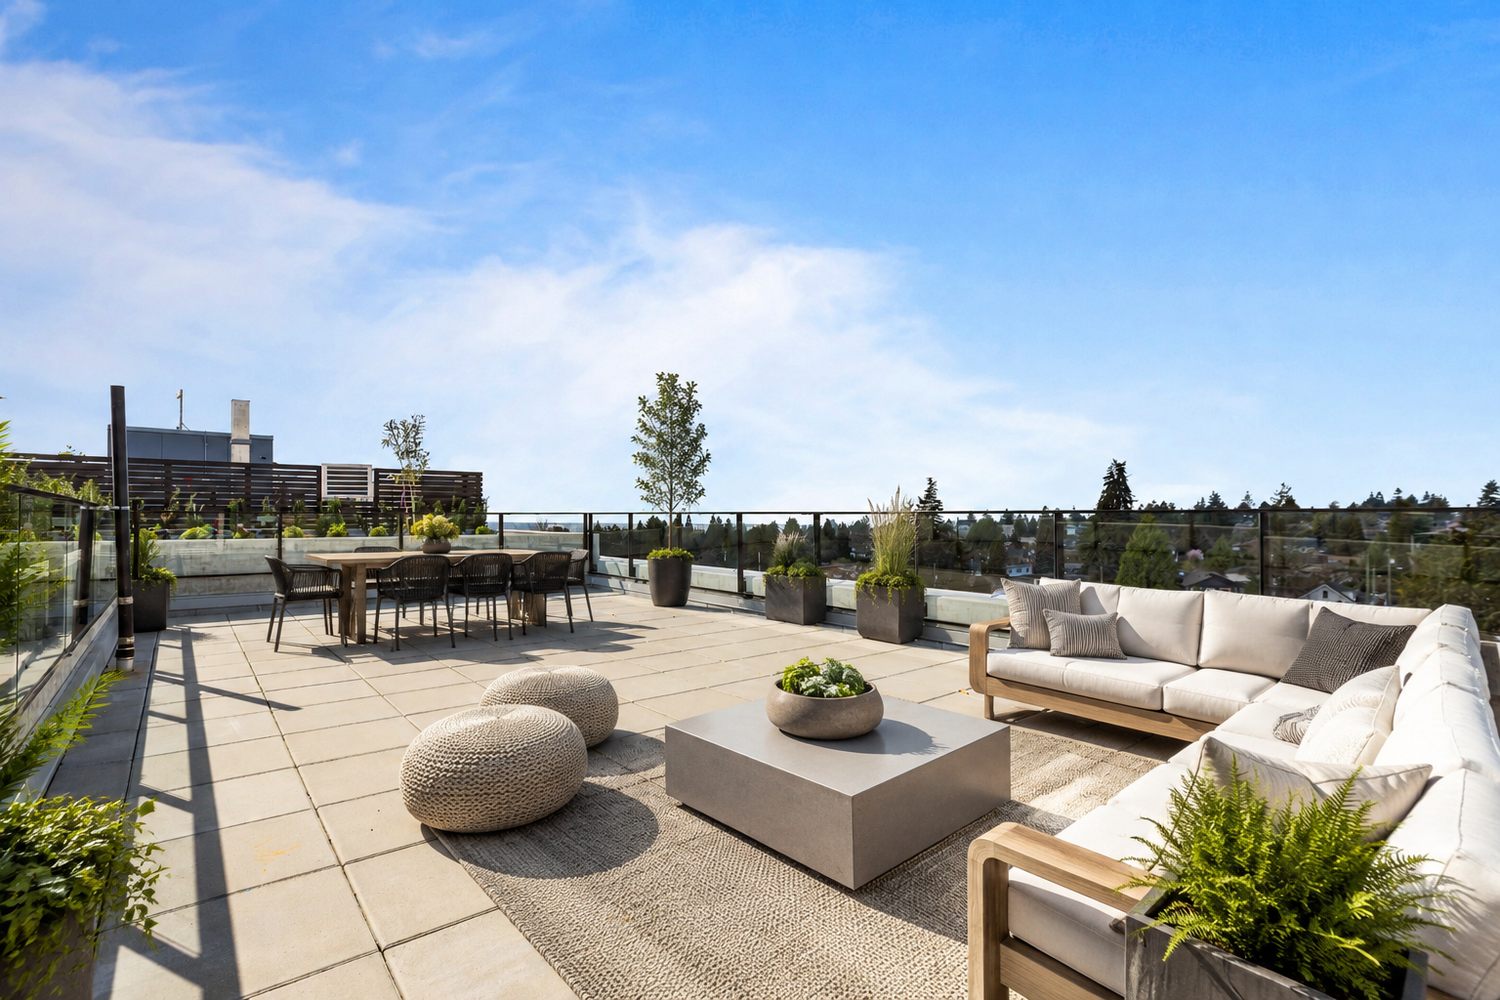
Fewer new listings, but plenty of choice
- New listings were down 11.6% from last October, but there are still 15,688 homes for sale – price for today's market from day one.
- Presentation counts: staging, photography and pre-inspections help your home stand out.
- Condo sales fell 16.7% year over year, so condo sellers should plan for more negotiation.
Benchmark prices by area
The benchmark price describes a typical home in each area, with the change from October 2025 underneath. Most benchmarks shown below are down on the year. The exceptions are West Vancouver condos (+4.5%), Tsawwassen and Squamish detached homes (+0.7% each) and Vancouver East townhouses (+0.4%). Richmond detached homes had the steepest drop (-11.1%).
| Area | Detached | Townhouse | Condo |
|---|---|---|---|
| Vancouver West | $2,899,700-9.0% | $1,285,000-5.7% | $751,400-3.8% |
| Vancouver East | $1,610,700-8.3% | $1,055,800+0.4% | $635,100-3.9% |
| North Vancouver | $2,058,800-2.2% | $1,221,100-5.9% | $736,300-6.1% |
| West Vancouver | $2,864,900-7.2% | n/a | $1,142,600+4.5% |
| Burnaby North | $1,795,200-7.1% | $873,000-5.3% | $660,400-5.7% |
| Burnaby South | $1,904,400-8.8% | $922,900-7.8% | $716,500-7.9% |
| Richmond | $1,833,100-11.1% | $1,009,300-4.5% | $625,700-8.8% |
| Coquitlam | $1,571,400-7.0% | $962,600-6.6% | $624,200-9.1% |
| New Westminster | $1,347,700-9.9% | $852,000-5.3% | $565,900-9.2% |
| Port Moody | $1,868,000-9.3% | $895,800-10.1% | $680,000-3.7% |
| Port Coquitlam | $1,235,900-8.4% | $854,900-3.3% | $551,200-7.6% |
| Maple Ridge | $1,138,500-8.6% | $686,600-9.5% | $481,600-8.3% |
| Ladner | $1,262,500-4.3% | $909,300-10.2% | $620,000-5.6% |
| Tsawwassen | $1,469,500+0.7% | $878,400-7.4% | $588,800-7.0% |
| Squamish | $1,681,800+0.7% | $968,600-6.2% | $599,600-0.1% |
Assessed values vs. today's market
BC Assessment's 2026 values reflect the market as of July 1, 2025, and most Lower Mainland homeowners saw changes between -10% and 0%. Since then, GVR's overall benchmark price has kept sliding (-5.2% year over year to October 2026), so in many areas today's market value may sit below your 2026 assessment. If you're selling, price off current sales, not your assessment notice. A regional benchmark can't tell you how far any one home's value has moved from its assessment – that depends on the home itself and recent nearby sales.
“The softening housing market is being reflected in 2026 property assessments.” Bryan Murao, Assessor, BC Assessment
| Municipality | Single-family (typical) | Strata (typical) |
|---|---|---|
| City of Vancouver | $2,092,000-5% | $772,000-3% |
| West Vancouver | $2,910,000-5% | $1,354,000-2% |
| North Vancouver (District) | $2,056,000-3% | $928,000-2% |
| North Vancouver (City) | $1,937,000-3% | $820,000-2% |
| Burnaby | $1,959,000-4% | $706,000-4% |
| Richmond | $1,745,000-8% | $735,000-6% |
| Coquitlam | $1,649,000-5% | $699,000-4% |
| Port Moody | $1,778,000-4% | $797,000-5% |
| Port Coquitlam | $1,358,000-4% | $648,000-5% |
| New Westminster | $1,560,000-2% | $617,000-4% |
| Delta (incl. North Delta) | $1,353,000-4% | $722,000-5% |
| Maple Ridge | $1,183,000-3% | $635,000-2% |
| Squamish | $1,515,000+2% | $848,000+2% |
Typical (median) assessed values for the 2026 roll, with change from the 2025 roll. Strata includes condos and townhouses. Delta covers the whole City of Delta, including North Delta. Source: BC Assessment, January 2, 2026.
What I'm watching as the year winds down
Interest rates
The Bank of Canada's next decision is December 9. It says there could be a need to raise its rate further but that it will proceed carefully, and GVR says financial markets are pricing in a slight chance of another quarter-point increase in December.
Expiring rate holds
GVR says some buyers may step in to use rate holds that will soon expire. Watch whether that gives sales a lift in November and December.
Inventory
Active listings are 24.0% above the 10-year October average, even with new listings down 11.6% from last October. Watch whether the ratio can stay above 12% as the year winds down.
Want to know what this means for your street?
Every neighbourhood – and every home – is a little different. I'm happy to put together a custom report on your area or talk through your plans.
Get in touch Get this report monthly