
Greater Vancouver
April 2026
Overall sales held close to last April, but detached sales jumped while condo and townhouse sales slipped, and prices eased slightly across every property type.
Subscribe for monthly reports-22.9% vs 10-year April average
+37.9% vs 10-year April average
-0.6% vs March 2026
Detached homes lead a spring split
April sales landed almost exactly where they were a year ago, but still well below what's typical for the month. Inventory is essentially unchanged from last spring and remains close to 40% above the 10-year April norm, so buyers continue to have plenty to choose from.
The bigger story is a split between property types. Detached sales rose 14% year over year while condo sales fell nearly 11%, and GVR notes the pattern shows up in most areas. Prices were fairly flat month to month – the overall benchmark is down 6.9% from last April, with detached homes still showing the largest annual drop.
“Sales of detached homes have been gaining year-over-year, while sales in the multi-family segment have declined, and this pattern is consistent across most areas.” Andrew Lis, Chief Economist & VP Data Analytics, Greater Vancouver Realtors
- What's changing: detached buyers are coming back first – sales were up 14% on last April, while condo sales fell 10.7% and townhouse sales dipped 2%.
- Rates: the Bank of Canada held its policy rate at 2.25% on April 29.
- The outlook: GVR says the detached segment has sometimes been a bellwether, and will be watching whether condos and townhouses follow as the market heads into summer.
Sales-to-active listings ratio
This ratio compares how many homes sold in the month to how many were for sale. Historically, when it stays below 12%, prices tend to soften; above 20% for several months, prices tend to rise.
What each segment is doing
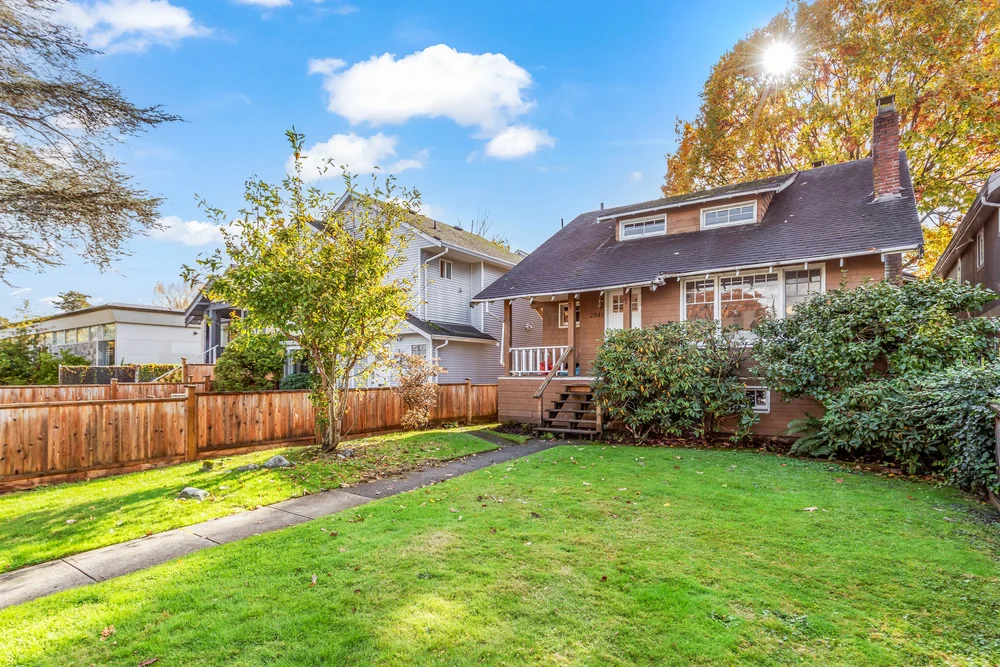
Detached
- vs last year
- -8.3%
- vs last month
- -0.8%
- April sales
- 659 (+14.0%)
- Sales-to-active
- 11.3%
Sales are picking up, but there's still lots of choice and prices are down the most of any type. Buyers have room to negotiate – while it lasts.
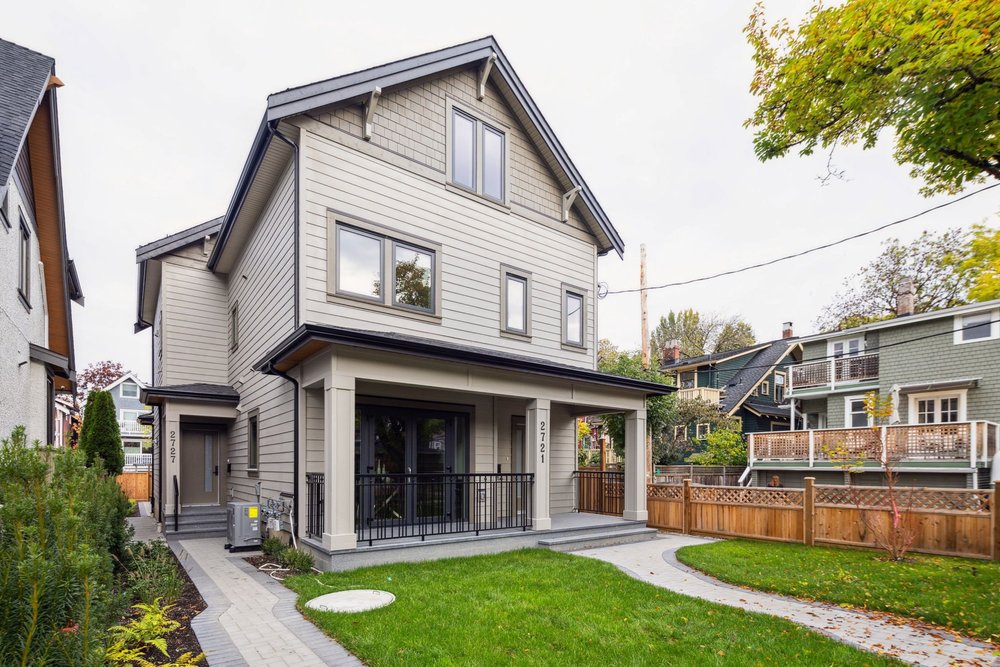
Townhouses & duplexes
- vs last year
- -5.1%
- vs last month
- -0.4%
- April sales
- 433 (-2.0%)
- Sales-to-active
- 15.0%
Still the firmest segment by ratio and the smallest price drop over the year. Well-priced family-sized homes continue to find buyers.
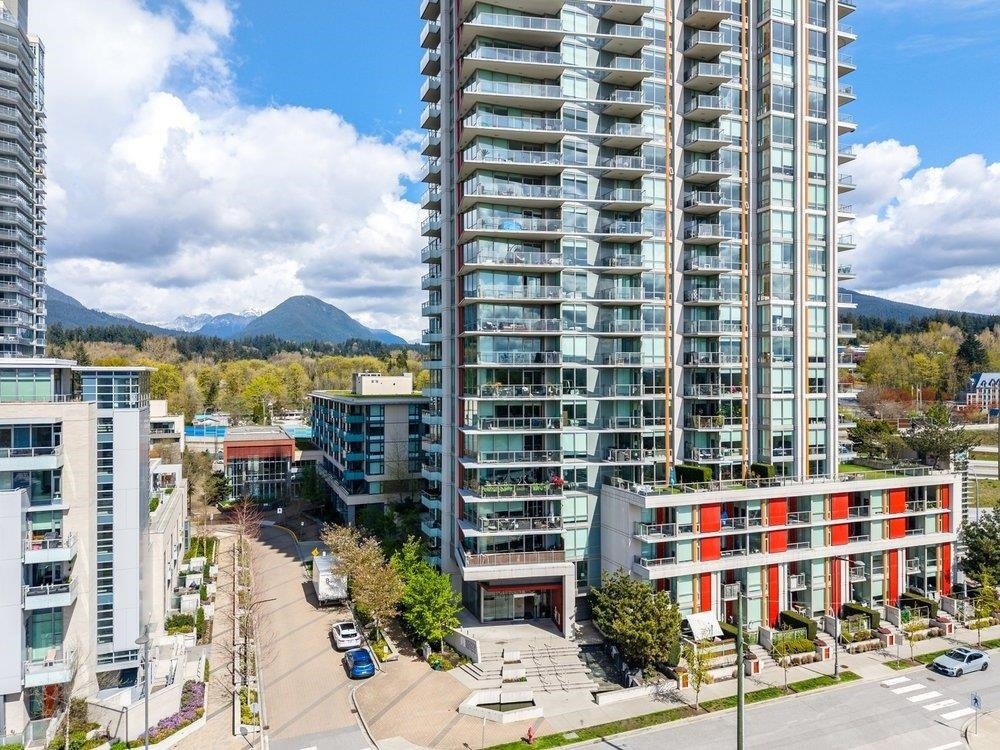
Condos
- vs last year
- -7.9%
- vs last month
- -0.5%
- April sales
- 1,009 (-10.7%)
- Sales-to-active
- 14.7%
Sales are down from last year, so first-time buyers can take their time, compare buildings and negotiate without bidding wars.
GVR reports duplexes, townhouses and row homes together as “attached” homes, and apartments/condos together.
Demand across Greater Vancouver
How many homes sold in April for every 100 new listings that came on. It's the best area-level read on demand GVR publishes each month. As a guide: under 40% leans toward buyers, 40–60% is balanced, and over 60% leans toward sellers.
| Area | Detached | Townhouse & duplex | Condo | All types |
|---|---|---|---|---|
| Vancouver West | 25%63 of 251 | 24%55 of 231 | 33%247 of 744 | 30% |
| Vancouver East | 28%76 of 269 | 30%78 of 262 | 33%103 of 308 | 31% |
| North Vancouver | 30%69 of 230 | 41%44 of 108 | 27%65 of 239 | 31% |
| West Vancouver | 22%37 of 170 | 38%6 of 16 * | 14%8 of 57 | 21% |
| Burnaby | 32%53 of 167 | 31%43 of 137 | 36%161 of 448 | 34% |
| Richmond | 31%66 of 213 | 28%47 of 165 | 40%130 of 324 | 35% |
| Coquitlam | 27%49 of 183 | 34%40 of 116 | 31%93 of 300 | 30% |
| New Westminster | 25%17 of 67 | 18%8 of 45 | 33%61 of 185 | 29% |
| Port Moody | 36%16 of 44 | 39%12 of 31 | 31%26 of 84 | 34% |
| Port Coquitlam | 34%26 of 76 | 33%15 of 46 | 24%19 of 78 | 30% |
| Maple Ridge / Pitt Meadows | 31%74 of 241 | 30%35 of 115 | 39%38 of 98 | 32% |
| South Delta | n/a | 31%11 of 36 | 32%18 of 56 | 32% |
| Squamish | 28%16 of 57 | 49%20 of 41 | 46%18 of 39 | 39% |
Region-wide, 2,110 sales against 6,684 new listings works out to 32% – spring brought a lot of new supply. Squamish townhouses and condos, North Vancouver townhouses and Richmond condos were among the most competitive pockets, while West Vancouver condos and detached homes and New Westminster townhouses leaned firmly toward buyers. (GVR didn't publish South Delta detached sales this month.)
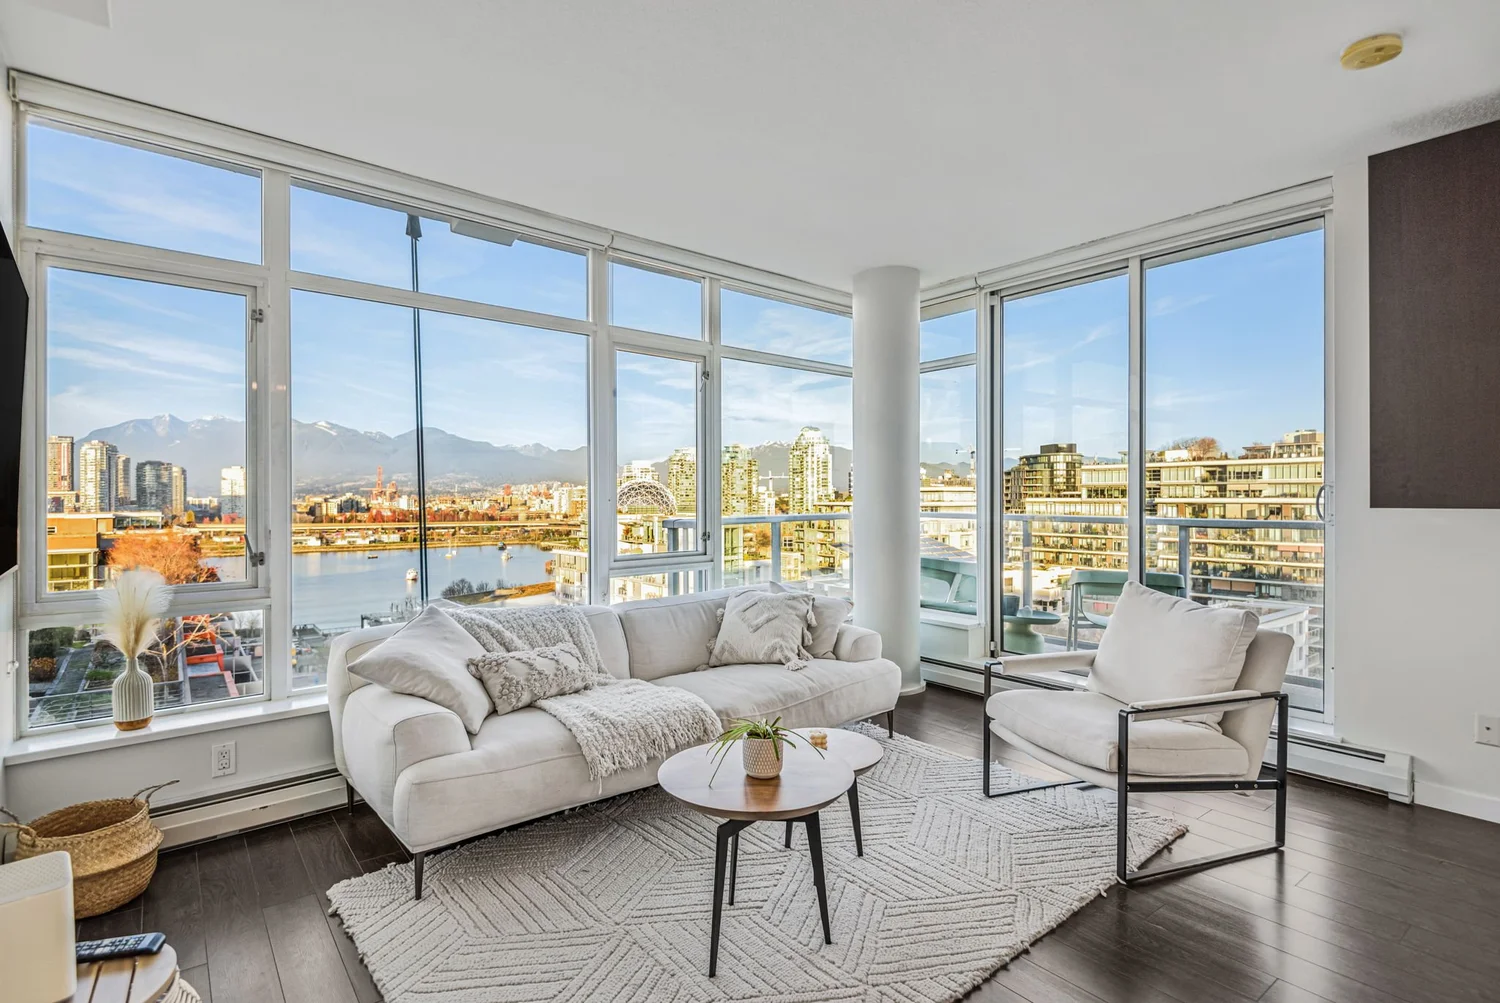
Choice now, momentum building
- Inventory is close to 40% above the 10-year April norm, so you can take your time and compare.
- Detached homes still leave room to negotiate, but sales are picking up – don't assume it will stay this quiet.
- Get pre-approved now – with rates on hold at 2.25%, you'll be ready to move when the right home comes up.
Stand out in a busy spring
- Spring brought a lot of new listings, so pricing right from day one matters more than ever.
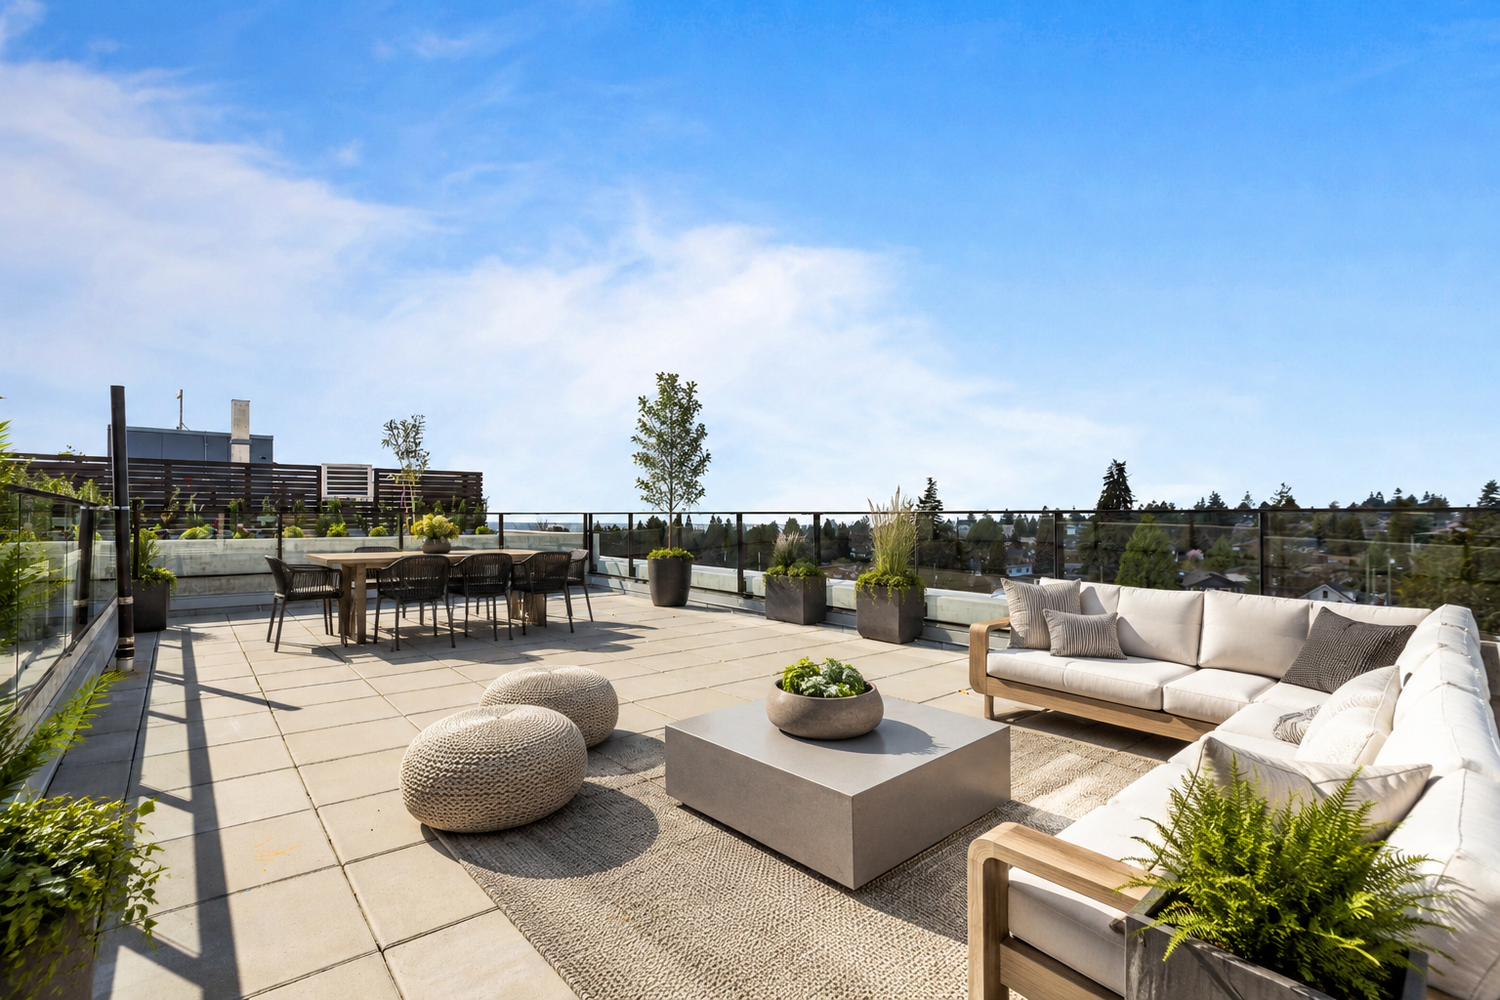
- Presentation counts: staging, photography and pre-inspections help your home stand out from the crowd.
- Detached sellers are seeing more buyer activity; condo sellers should expect buyers to compare carefully and negotiate.
Benchmark prices by area
The benchmark price describes a typical home in each area, with the change from April 2025 underneath. Almost every area and property type is down on the year – Squamish detached homes and Burnaby North townhouses are the rare exceptions, while West Vancouver and Squamish condos saw the steepest drops.
| Area | Detached | Townhouse & duplex | Condo |
|---|---|---|---|
| Vancouver West | $2,979,500-11.6% | $1,340,400-5.4% | $790,300-6.8% |
| Vancouver East | $1,681,000-9.5% | $1,026,200-8.0% | $664,800-5.6% |
| North Vancouver | $2,129,900-2.8% | $1,273,700-3.9% | $784,500-4.0% |
| West Vancouver | $2,872,300-13.6% | n/a | $1,017,000-15.0% |
| Burnaby North | $1,888,200-11.1% | $931,900+0.9% | $695,500-6.6% |
| Burnaby South | $1,983,300-10.5% | $1,005,700-2.2% | $758,000-8.5% |
| Richmond | $1,964,000-9.0% | $1,036,400-7.2% | $662,200-9.3% |
| Coquitlam | $1,635,700-7.7% | $1,008,100-6.0% | $664,000-8.5% |
| New Westminster | $1,439,500-10.4% | $877,100-5.2% | $595,600-8.7% |
| Port Moody | $1,936,100-5.4% | $961,400-5.6% | $703,400-4.1% |
| Port Coquitlam | $1,326,700-5.7% | $896,900-5.8% | $580,400-8.8% |
| Maple Ridge | $1,231,500-5.6% | $723,900-8.1% | $503,900-8.6% |
| Tsawwassen | $1,530,000-5.7% | $924,100-6.0% | $606,600-9.7% |
| Squamish | $1,693,700+1.7% | $1,002,400-1.5% | $491,900-20.9% |
Assessed values vs. today's market
BC Assessment's 2026 values reflect the market as of July 1, 2025, and most Lower Mainland homeowners saw changes between -10% and 0%. Since then, GVR's overall benchmark price has continued to ease (-6.9% year over year to April 2026), so in many areas today's market value may sit below your 2026 assessment. If you're selling, price off current sales, not your assessment notice.
“The softening housing market is being reflected in 2026 property assessments.” Bryan Murao, Assessor, BC Assessment
| Municipality | Single-family (typical) | Strata (typical) |
|---|---|---|
| City of Vancouver | $2,092,000-5% | $772,000-3% |
| West Vancouver | $2,910,000-5% | $1,354,000-2% |
| North Vancouver (District) | $2,056,000-3% | $928,000-2% |
| North Vancouver (City) | $1,937,000-3% | $820,000-2% |
| Burnaby | $1,959,000-4% | $706,000-4% |
| Richmond | $1,745,000-8% | $735,000-6% |
| Coquitlam | $1,649,000-5% | $699,000-4% |
| Port Moody | $1,778,000-4% | $797,000-5% |
| Port Coquitlam | $1,358,000-4% | $648,000-5% |
| New Westminster | $1,560,000-2% | $617,000-4% |
| Delta | $1,353,000-4% | $722,000-5% |
| Maple Ridge | $1,183,000-3% | $635,000-2% |
| Squamish | $1,515,000+2% | $848,000+2% |
Typical assessed values for the 2026 roll, with change from the 2025 roll. Strata includes condos and townhouses. Source: BC Assessment, January 2, 2026.
What I'm watching heading into summer
Detached momentum
GVR first flagged the detached-versus-condo split in March, and it widened in April. Watch whether condos and townhouses follow, as GVR suggests they might.
Interest rates
The Bank of Canada held at 2.25% on April 29. Its next decision on June 10 is one to watch for anyone renewing or buying this spring.
Pent-up demand
GVR is watching whether sidelined buyers return heading into summer. If they do, today's high inventory could start to draw down.
Want to know what this means for your street?
Every neighbourhood – and every home – is a little different. I'm happy to put together a custom report on your area or talk through your plans.
Get in touch Get this report monthly